CloudNine Review is a powerful and comprehensive document review software that caters to the needs of law firms, corporations, and government agencies. It offers an array of features and tools to streamline the document review process and production, increasing efficiency and productivity for legal professionals. With its sophisticated technology and user-friendly interface, CloudNine Review has become a trusted solution in the field of eDiscovery.
CloudNine Review is one powerful document review platform:
eDiscovery has never been easier! With fast, self-service ingestion, review, and production, CloudNine Review’s easy-to-use platform provides a stellar user experience and empowers law firms and enterprises to control eDiscovery with world class review functionality.
Key Features:
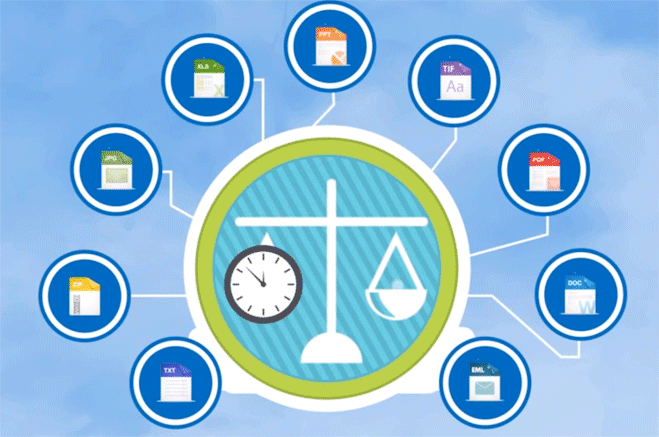
- Streamlines processing: With over 4,500+ supported file types (everything from text messages to video files), no data source goes undiscovered. Automated OCR, content extraction and language identification reduces the time it typically takes to prepare all data and documents for review.
- Accelerates review: With near duplicate detection, email threading and inclusive email identification, culling data is easy.
- Simplifies production: Make the complex simple with production templates. Never worry about making the wrong production again.
- Ensures security: Ensure unauthorized access. With single sign-on, IP restrictions, ISO certification and a SOC 2 data center, security is built into CloudNine Review.
- Integrates seamlessly: CloudNine Review integrates and complements other software packages in the CloudNine family.
- Amplify your productivity: Integrations to CloudNine Explore and CloudNine Concordance.
Ready to see how you can take your document review to the next level? Schedule a Demo today.
eDiscovery Review Software
The Speed You Want with the Control You Need
A fast, secure and easy-to-use SaaS platform empowers self-service users to load and export data quickly and begin discovery activities within five minutes. CloudNine Review delivers high service levels with all the features and functionality you need, and nothing you don’t.
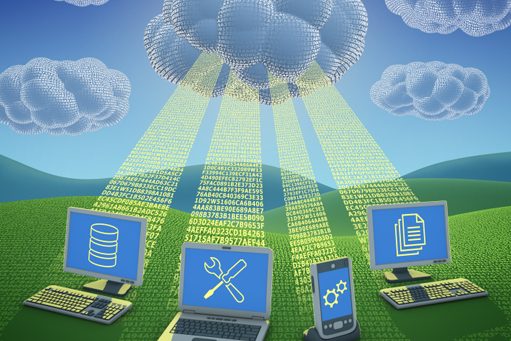
UPLOAD
To get started, simply upload your data directly into our private and protected cloud environment and CloudNine’s automated processing will immediately begin to convert your documents into a searchable and reviewable format.
The speed you want with the control you need.
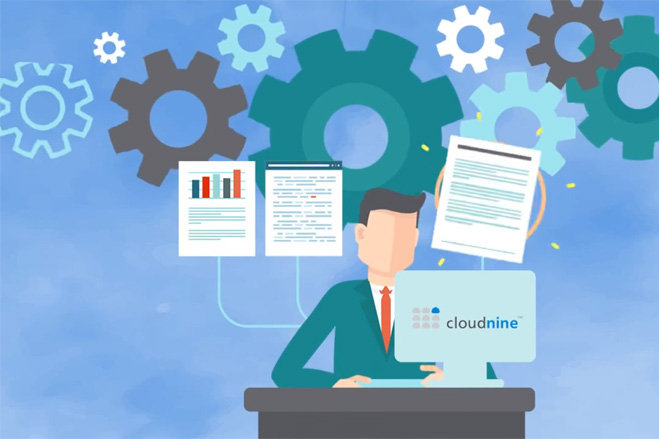

REVIEW
Within minutes of uploading data, you can begin to use CloudNine’s full featured review tool to assess, review, and analyze your documents with advanced search and analytics integrated into an intuitive interface.
The simplicity you want with the power you need.
PRODUCE
CloudNine’s integrated production features give you the ability to create precision productions and privilege logs exportable into almost any format. While typically used at the completion of a project, this capability can be used at any point after upload.
The precision you want with the flexibility you need.
CloudNine Review Ranks #1, Most-Trusted eDiscovery Solution
Market-leading performance combined with transparent pricing and the highest service levels in the industry earns CloudNine Review the top ranking of most-trusted eDiscovery solution among corporate and LSP clients.
View IDC’s 2020 Legal Tech Buyer Survey
Speed You Can Trust
- We back up our claims so you can confidently rely on consistent performance that won’t let you down when it matters most.
Support When You Need It
- The CloudNine team of experts are here when you need us, with services like user training, loading data and more built in to every contract at no cost and additional options available as needed.
ROI You Can Measure
- Choose between an all-inclusive annual subscription or a right-sized contract based on your usage and requirements. Either way, you pay only for what you need.
Flexibility You Can Take to the Bank
- CloudNine Review connects seamlessly with our on-premises offerings like CloudNine Concordance. Run eDiscovery in the cloud and store pending and archived data on-prem to dramatically reduce costs and optimize cost recovery.
What’s New with CloudNine Review
- Modern interface, self-service productions and 10x faster imaging.
- Seamless integration with CloudNine Explore™ to enable complete and independent document production using the fastest eDiscovery processing engine on the market.
- Increase productivity with streamlined, intuitive navigation.
- Improve workflow efficiency by reducing the demand on critical hardware resources.
- Accelerate Service Levels including the flexibility to leverage Self-Service Plus for added support in Production Services and consulting.
- Imaging on the Fly with new Admin-only functionality to create images on individual records and searches.
SERVICES
CloudNine complements its simplified eDiscovery automation offering with a complete portfolio of professional services delivered by an experienced team of information technology, project management, and legal professionals. These professional service offerings include:


This provision of professional services is also different from most eDiscovery automation vendors as they tend to focus only on the automation software. With CloudNine you get the benefit of the latest in eDiscovery automation technology supported by a complete staff of eDiscovery, project management, and information technology professionals with deep professional service experience.
READY TO SEE THE SOFTWARE IN ACTION?
Request a CloudNine demo and see how easy eDiscovery can be!
First Day With CloudNine
An actual example of new customer’s first day with CloudNine:
Registered Online (With No Contract) and Began to Upload Data
Processed 300,000 Documents (Emails and Attachments)
Accomplished These Tasks within 24 Hours of Registering
Uploaded 27GB of PST Email Files
Reduced Document Set by 61% with Deduplication and Irrelevant Domain Filtering
PRICING MODELS TO MEET EVERY BUSINESS REQUIREMENT

Contact CloudNine Today For Flexible Pricing Options:
Pay-Per-Use Model: Experience unlimited usage with no monthly commitment.
Volume-Based Subscription Model: Discover significant savings with a six-month commitment. (Multiple options for Pro, Plus and Premium plans).
GET A DEMO OF CloudNine SOFTWARE
FAQs:
eDiscovery document review is the process of reviewing documents during a legal proceeding. It is a vital component of electronic discovery (eDiscovery) and involves the identification, preservation, collection, processing, and analysis of electronically stored information (ESI) for use in court proceedings.
Document review is an important step in the eDiscovery process. It is the stage where a company examines collected documents to determine if they are relevant, responsive, or privileged in relation to the legal matters at hand. It is also known as review and happens before those documents are produced. Document review is not just for litigation though; it can be used in regulatory investigations, subpoenas and third-party requests, internal investigations and due diligence assessments for mergers and acquisitions.
Depending on the size of the matter and availability of resources within a company’s legal team, one person may take responsibility for reviewing all of the documents in an eDiscovery set. Alternatively, companies with larger matters may appoint multiple in-house reviews or hire outside counsel or vendors to provide specialized assistance with reviews, legal holds, and cataloging digital documents or paper documents. In any case, document review is an important element in the life cycle of a legal matter that helps ensure that only relevant materials are produced as evidence.
Document review can be done manually or using specialized eDiscovery Review Software (a subset of eDiscovery software and document management software). eDiscovery review software is powerful and can facilitate eDiscovery with features including providing full text search capabilities of electronic documents, managing legal holds, providing a collaboration platform (sharing documents with clients, for example), leveraging artificial intelligence, and integrating with other software products. Some of these platforms may be on-site while others may be SaaS implemented.
Manual document review is a time consuming and tedious process in which legal professionals such as attorneys, paralegals, and law clerks meticulously review each document to determine its relevance to the case. This involves thoroughly reading documents to identify key words or phrases that may indicate whether the document should be marked as relevant or not. Manual document review (either in conjunction with or without a specific document management solution) can be used for both pre-litigation research and post-litigation discovery.
Legal document review software like CloudNine Review leverages the power of computers and optimized algorithms to streamline and automate the document review process. eDiscovery review software provides access to data from multiple sources, allows for keyword searches of all documents, and offers analytics capabilities to identify patterns or trends in the data. Another prime benefit of employing legal review software is that it allows users to quickly narrow down the scope of documents that will need to be manually reviewed.
By automating these traditionally time-consuming tasks, legal professionals can save significant amounts of time while ensuring accuracy and consistency in their productions.